

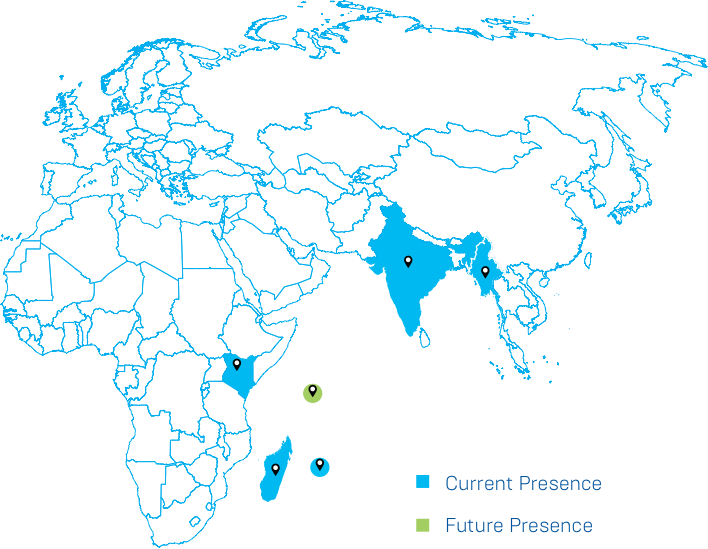
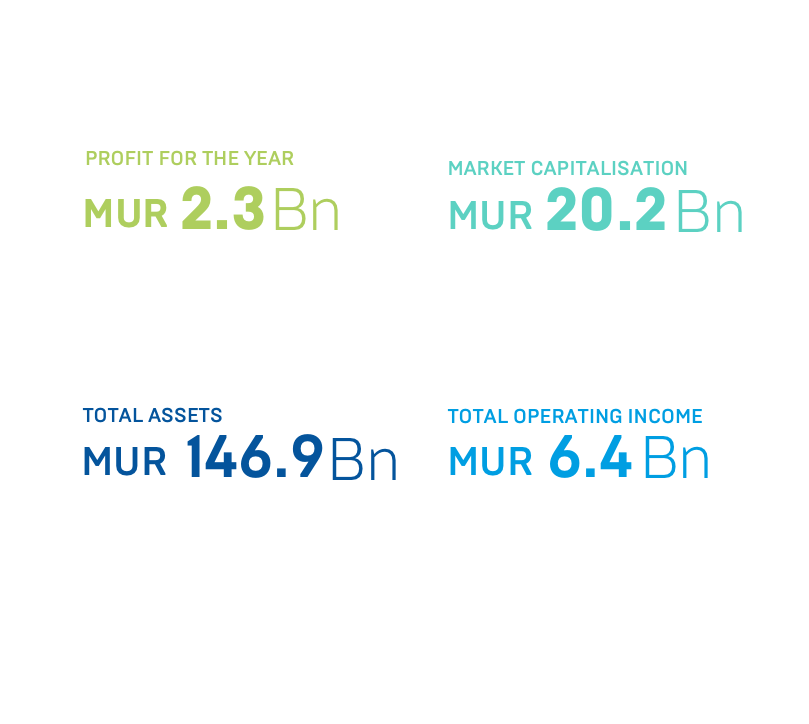
SBM Group is one of the largest banking and financial services institutions in Mauritius. With a market capitalisation of MUR 20 billion as at end December 2016, the Group’s holding entity, SBM Holdings Ltd, is the third largest listed company on the Stock Exchange of Mauritius. SBM Group is present in Mauritius, Madagascar, India and Kenya with a representative office in Myanmar and plans to start operations in Seychelles during 2017.
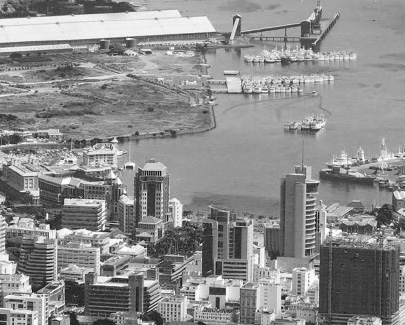
SBM Group is one of the largest banking and financial services institutions in Mauritius.
With a market capitalisation of MUR 20 billion as at end December 2016, the Groupís holding entity, SBM Holdings Ltd, is the third largest listed company on the Stock Exchange of Mauritius.
SBM Group is present in Mauritius, Madagascar, India and Kenya with a representative office in Myanmar and plans to start operations in Seychelles during 2017.
Moody’s Ratings*
Bank Deposits: Baa3/P-3
Issuer Rating: Baa3
Outlook: Stable
*Ratings for SBM Bank (Mauritius) Ltd
as at November 2016
Kee Chong LI KWONG WING,
G.O.S.K, LLM, BSC (Econ).
To Our Valued Stakeholders:
It is a privilege for me to present to you this second Integrated Annual Report published under my chairmanship. The year 2016 was marked by several achievements as SBM Group realised a much improved performance while further consolidating its foundation for future growth.
Financial Publishing Solutions by NUMBERS
To Our Valued Stakeholders:
It is a privilege for me to present to you this second Integrated Annual Report published under my chairmanship. The year 2016 was marked by several achievements as SBM Group realised a much improved performance while further consolidating its foundation for future growth.
In line with our mission and core values, we are committed to creating value for our multiple stakeholders (refer to pages 28-29). Besides, we have geared up efforts since the last two years to improve transparency in disclosures and foster engagement among our stakeholders. This report thus marks a further improvement in our reporting, aligned to international best practices (refer to page 6).
The operating environment continues to be challenging. On the domestic front, weak credit growth, excess liquidity and heightened competition in the banking sector are exerting continued pressure on our business volumes and interest rate margins. Legislation is also being tightened, both at the local and international levels, particularly with regards to compliance and reporting requirements. Whilst we embrace changes that would reinforce the stability of the financial system, we recognise that they would imply higher short term compliance costs. (Refer to pages 36 to 40 for a more detailed discussion of the operating environment in the different geographies where we are present).
2016 Group’s Profit After Tax:

Notwithstanding the difficult context, and even as we invest heavily to strengthen our information technology and human capital, the financial performance of SBM Group has recovered strongly after the blip recorded in 2015.
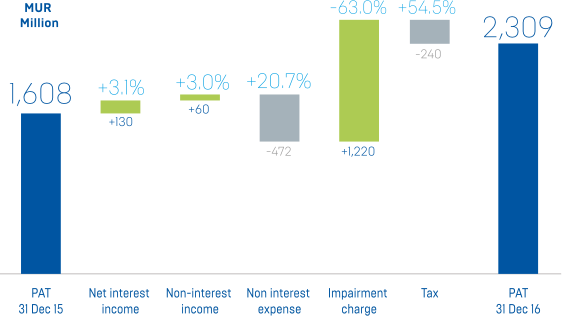
The Group’s operating income rose by 3.04% year on year to MUR 6.45 billion (2015: MUR 6.26 billion). The Group continued to grow its core income items: net interest income increased by 3.07% to MUR 4.38 billion (2015: MUR 4.25 billion), net fee and commission income increased by 2.31% to MUR 1.05 billion (2015: MUR 1.03 billion) and non-interest income increased by 3.00% to MUR 2.06 billion (2015: MUR 2.00 billion).
Meanwhile, non-interest expense rose by 20.70% to MUR 2.74 billion (2015: MUR 2.27 billion) on account of higher personnel expenses (12.84% increase) and depreciation and amortisation cost (116.67% increase). The substantial rise in depreciation and amortisation cost is due to charges related to our new IT system, known as “Flamingo Project”.
In a difficult credit environment, both domestically and in our overseas operations, the gross impaired advances to gross advances ratio increased from 5.14% in 2015 to 6.60% in 2016, but the net impaired advances to net advances ratio was 2.64% in 2016 (2015: 1.87%), comparing favourably with peers. However, the net impairment loss of financial assets declined significantly to MUR 717 million in 2016 (2015: 1,937 million), in view of the one-off rise in the preceding year.

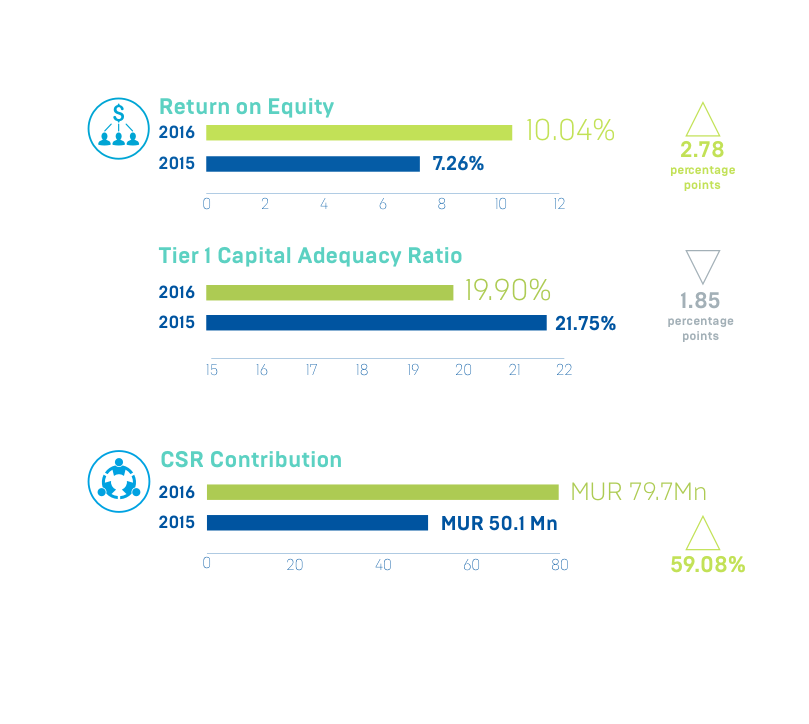
Overall, the profit after tax of the Group increased by 43.59% from MUR 1,608 million for the year ended 31 December 2015 to MUR 2,309 million for the year ended 31 December 2016. Accordingly, earnings per share rose from 62.27 cents to 89.43 cents. Shareholders’ equity amounted to MUR 23.80 billion in 2016, up by 7.28% as compared to 2015 while Tier 1 capital rose from MUR 18.25 billion to MUR 18.60 billion over the same period. Return on assets, return on equity and return on Tier 1 capital improved from 1.23%, 7.26% and 8.32% respectively in 2015 to 1.63%, 10.04% and 12.53% in 2016.
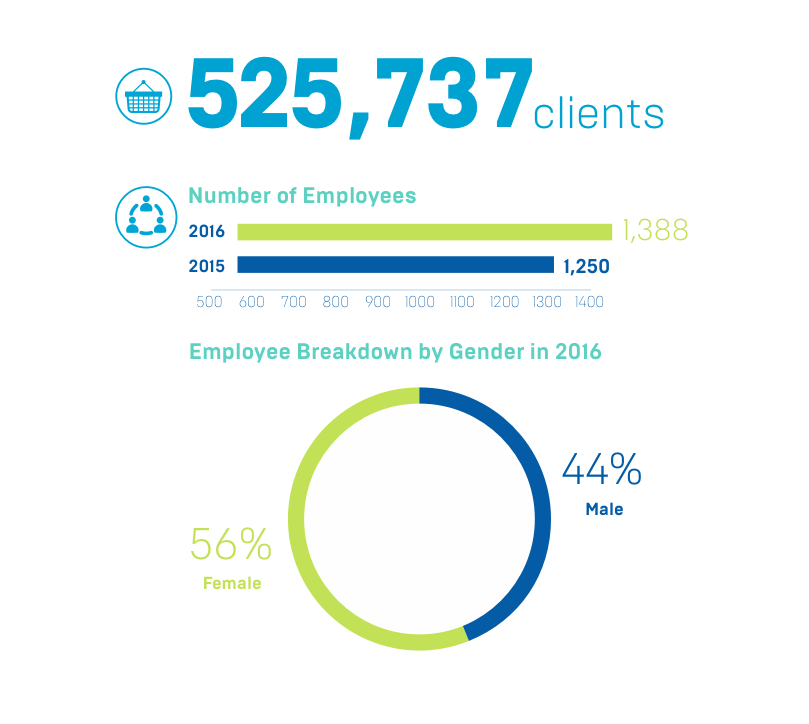
The superior performance has enabled us to continuously create value for our stakeholders. Value created for employees increased from MUR 1,237 million in 2015 to MUR 1,396 million in 2016, as we gear up our workforce in line with our growth ambitions, and continuously invest in training and employee welfare (also see ‘Employees’ section at pages 80 to 86).
Besides, our contribution to community-based activities went up significantly from MUR 50 million in 2015 to MUR 80 million in 2016 (see section on ‘SBM in the Community’ at pages 87 to 91). Through our flagship SBM Scholarship Scheme – which aligns to our objective of promoting economic empowerment through education – we have helped more than 2,000 bright and needy students, and their families, have access to a potentially better future.
Conscious that customer needs are constantly evolving, we use market insights to provide more value added products and services to our customers. For instance, given the low interest rate environment, we introduced capital protected funds and a leveraged bond to provide potentially higher return to our customers across different risk profiles. Our investment in technology also aims at providing a seamless omnichannel experience to our customers, coupled with enhanced security. More details of new products and services, as well as performance of existing products can be found at pages 41 to 52.
We have also engaged with multiple suppliers and strategic partners to provide enhanced value to customers. These include product tie-ups as well as provision of key services including training, IT and infrastructure. Besides, value created for the Government increased by 53.89%, from MUR 390 million to MUR 600 million.
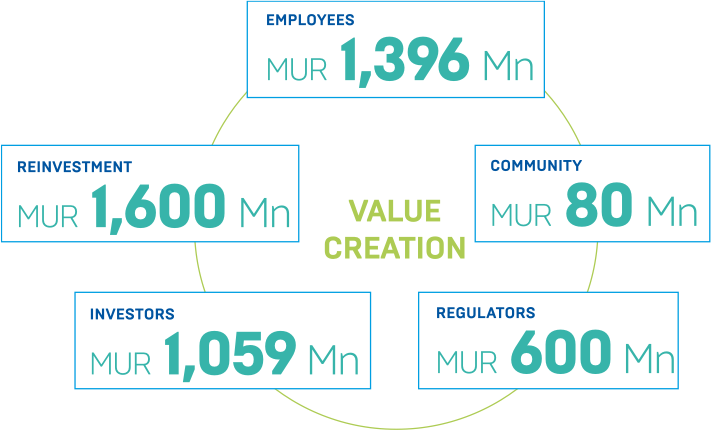
As regards our shareholders, besides the improvement in return on equity, we have also maintained a dividend per share of 40.00 cents. This represented a payout ratio of 44.7% while the dividend yield as at 31 December 2016 stood at an attractive 6.02% (2015: 5.63%). We recognise that the return on equity achieved is below our long-term target, and our strategy is to increase it to above 15% in 2017, and further upward in subsequent years. Dividend payments should also rise in line with increased profitability.
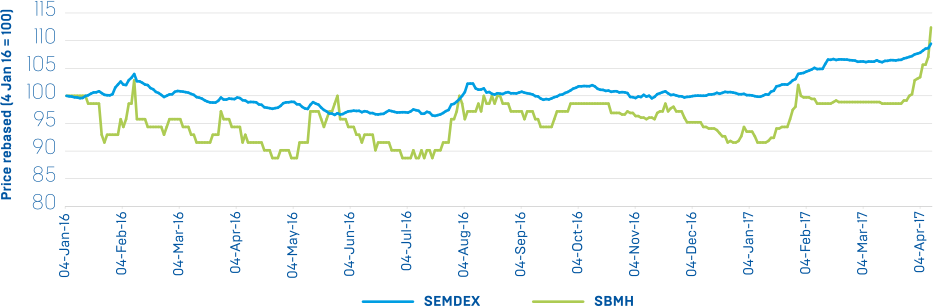
A key event in 2016 was our reverse share split whereby each shareholder received 1 ordinary share for every 10 ordinary shares held. On a year-on-year basis, the share price declined by 6.93%, from MUR 7.10 as at 04 January 2016 to MUR 6.64 as at 30 December 2016. However, in the first few months of 2017, the share price rallied by 20.18% to reach MUR 7.98 as at mid-April.
Enhanced value creation for stakeholders is an indication that our strategy is bearing fruit. In 2016, we made important headway along all five pillars of our strategy, namely consolidation, diversification, expansion, modernisation and capacity building. We consolidated our market share in the domestic banking business on the back of improved service – with, notably, a reduction in turnaround time – and an enhanced bouquet of products and services. The diversification focus has been through the creation of a Private Wealth segment. This complements our Personal Banking offering and is in line with the fast rising population of ultra-high net worth individuals in Mauritius and in Africa.
On the expansion front, a key focus of our strategy, the international business team has been overhauled, with capabilities strengthened around specific geographies – Africa, Middle East, Asia – and competency areas – Trade Finance and Financial Institution business. Although the bulk of the team was onboarded in the latter part of 2016, the year-on-year growth in advances was impressive at MUR 5.9 billion, or 92%. The share of international banking business has grown from 11% in 2015 to 16% in 2016 and, on the current momentum, is set to grow further – and significantly – in 2017 and the coming years. We were granted a banking license, subject to conditions, to operate in the Seychelles. We also initiated the takeover of Fidelity Commercial Bank in Kenya, which was successfully completed on 10 May this year.
Regarding modernisation initiatives, key milestones were reached in May 2016 and September 2016 with the successful go-live of the new technology systems in Madagascar and Mauritius respectively. The above initiatives were supported by capacity building at the level of human resources, with additional recruitment at all levels. The leadership team was revamped with the recruitment of Messrs Dussoye and Lutchmenarraidoo as Chief Executive Banking and Chief Executive Non-Banking respectively, thereby reinforcing governance. Besides, the risk management framework was propped up to align to the new growth areas identified by the Board. (See pages 74 to 79 for a review of our technology initiatives, pages 142 to 186 in respect of leadership and governance initiatives, and pages 94 to 141 for a discussion on risk management).
Looking ahead, we will continue to execute our strategy in a focused manner.The key strategic targets for 2017 include: (1) Increase in domestic banking market share; (2) Higher contribution from the non-banking financial cluster; (3) New services such as investment banking, factoring, microfinance and credit insurance to be launched; (4) Further increase in the share of international business: (5) Setting up operations in Kenya and Seychelles; (6) Wholly-owned subsidiary
Enhanced value creation for stakeholders is an indication that our strategy is bearing fruit. In 2016, we made important headway along all ve pillars of our strategy, namely consolidation, diversi cation, expansion, modernisation and capacity building.
structure to be set up in India; (7) Digital banking and analytics initiatives to be implemented; (8) Further consolidation at leadership and governance level; (9) Strengthening of risk management practices; and (10) Revamping of HR structures and policies.
On the basis of the above initiatives, we expect the return on equity to increase to at least 15% from the current level of 10%. At the same time, we will be sowing the seeds for future growth pillars to further diversify our income base, thus reinforcing the resilience of the Group.
These are exciting times for the Group and I am proud to be supported by capable fellow directors, a results-driven executive leadership and a passionate and dedicated workforce. Together, we are focused on building a strong brand and enhancing value creation for all our stakeholders.

Kee Chong LI KWONG WING, G.O.S.K, LLM, BSC (Econ).